Code
from astropy.coordinates import EarthLocation, get_sun, AltAzfrom astropy.time import Timefrom astropy import units as ufrom astropy.visualization import quantity_support, time_supportfrom matplotlib import pylab as pltimport matplotlib.dates as mdatesimport numpy as np
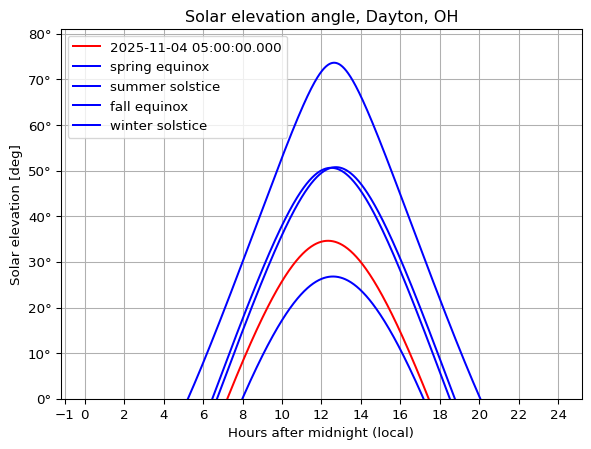
Select the location and time.
Code
#llh = np.array([34.73,-86.58,195]) # deg, deg, meter - Huntsville = "Dayton, OH" = np.array([39.76 ,- 84.19 ,226 ]) # deg, deg, meter - Dayton = EarthLocation(lat= llh[0 ],lon= llh[1 ],height= llh[2 ])= - 5 * u.hour # EST = Time("2025-11-04 00:00:00" ) - utcoffset
Code
= np.linspace(0 , 24 , 1000 ) * u.hour= local_midnight + delta_midnight= AltAz(obstime= times, location= pos)= get_sun(times).transform_to(frame)= sunaltazs.alt= Time("2025-03-21 00:00:00" ) - utcoffset= Time("2025-06-21 00:00:00" ) - utcoffset= Time("2025-09-21 00:00:00" ) - utcoffset= Time("2025-12-21 00:00:00" ) - utcoffset= [spring_equinox,summer_solstice,fall_equinox,winter_solstice]= ["spring equinox" ,"summer solstice" ,"fall equinox" ,"winter solstice" ]with quantity_support():= plt.subplots()#ax.xaxis.set_major_formatter(mdates.DateFormatter('%H')) = mdates.AutoDateLocator(maxticks= 20 )'r' ,label= f' { str (local_midnight)} ' )for sd,sn in zip (specdates,specnames):= sd + delta_midnight= AltAz(obstime= times, location= pos)= get_sun(times).transform_to(frame)'b' ,label= sn)f'Solar elevation angle, { location_name} ' )= np.array(ax.get_ylim())0 ] = 0.0 'Hours after midnight (local)' )'Solar elevation [deg]' )