Sun elevation over the year and range of latitudes
Compute hours of sun light above a given solar elevation angle for specific latitudes over a range of dates in the year. Using 2025 as the example year.
Code
from astropy.coordinates import EarthLocation, get_sun, AltAzfrom astropy.time import Timefrom astropy import units as ufrom astropy.visualization import quantity_support, time_supportfrom matplotlib import pylab as pltimport matplotlib.dates as mdatesimport numpy as npfrom scipy import signal as spsfrom tqdm import tqdm# disable TQDM for non-interactivetqdm_disable=True
# delta_time = np.linspace(0, 24, 1) * u.hour# create positionslats = np.arange(latitude_minimum_deg, latitude_maximum_deg, latitude_step_deg)pos = EarthLocation(lat=lats,lon=longitude_deg, height=height_m)num_per_day =24*2# 24 hours * 2 - half hour incrementsnum_times =365* num_per_day # 365 days * num_per_daytimes = np.linspace(start_date,end_date,num_times,endpoint=True)daynum = (times - times[0]).jd# this syntax would assign one time to each single location# so times and pos must be the same length# frame = AltAz(obstime=times, location=pos)## instead use list comprehension to create a 2-D array fo position and timesframes = [ AltAz(obstime=_t, location=pos) for _t in tqdm(times,disable=tqdm_disable,desc ='frames') ]# sunlocs is the slow calculationsunlocs = [get_sun(frames[0].obstime).transform_to(_f) for _f in tqdm(frames,disable=tqdm_disable,desc='sunlocs')]alts = [ _sunloc.alt for _sunloc in tqdm(sunlocs,disable=tqdm_disable,desc='alts') ]# reformat into an arrayaltslats = np.zeros([len(times),len(lats)])for ii in tqdm(range(len(alts)),disable=tqdm_disable,desc='altslats'): altslats[ii,:] = alts[ii]
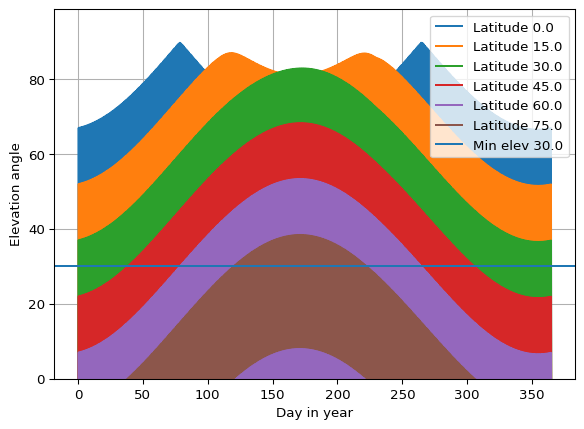
Make a plot of the solar elevation at different latitudes over the entire time.
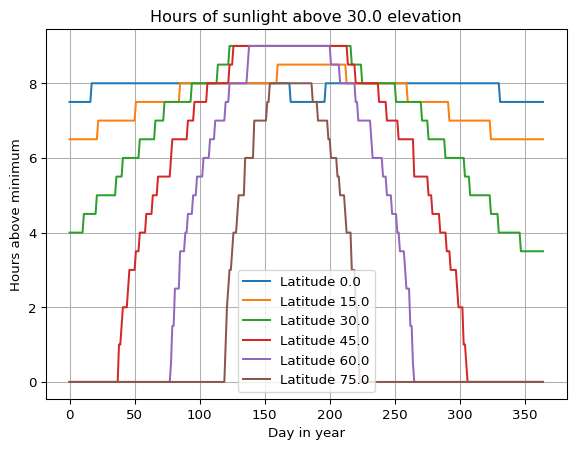
Compute time per day with sun elevation above the minimum
Code
# find where the elevation is greater or equal than the minimum# creates bool array of size [num_times, num_lats] where True is# above thresholdang_above_min = np.asarray(altslats >= minimum_solar_angle_deg)# now do some scipy-fu to get the number of times per day using# scipy's convolve function# kernel of number of blocks per day normalized to the time of# each block in hoursconv_kernel = np.ones(num_per_day) * np.diff(daynum)[0]*24# compute the sum for each day and select just the first value# for each day. day_sum = np.apply_along_axis(lambda m: sps.convolve(m, conv_kernel, mode='full'), axis=0, arr=ang_above_min)[num_per_day::num_per_day,:]
Plot the result
Code
fig, ax = plt.subplots()for ii,_lat inenumerate(lats): ax.plot(daynum[::num_per_day], day_sum[:,ii],label=f'Latitude {_lat}')ax.set_xlabel('Day in year')ax.set_ylabel('Hours above minimum')ax.set_title(f'Hours of sunlight above {minimum_solar_angle_deg} elevation')ax.grid()ax.legend()
Figure 2: Hours when sun elevation exceeds minimum for each day
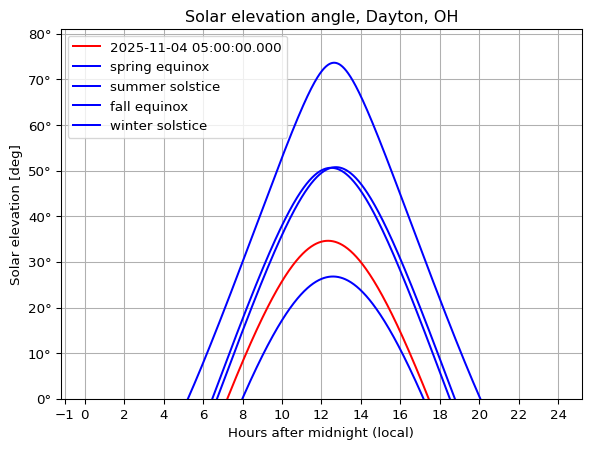
Plot solar elevation at a single point on one day
Select the location and time. This example is Dayton, Ohio.
---title: Compute solar elevation angles and hours of sunlight---## Sun elevation over the year and range of latitudesCompute hours of sun light above a given solar elevation angle for specific latitudes over a range of dates in the year. Using 2025 as the example year.```{python}#| label: python-config#| code-fold: showfrom astropy.coordinates import EarthLocation, get_sun, AltAzfrom astropy.time import Timefrom astropy import units as ufrom astropy.visualization import quantity_support, time_supportfrom matplotlib import pylab as pltimport matplotlib.dates as mdatesimport numpy as npfrom scipy import signal as spsfrom tqdm import tqdm# disable TQDM for non-interactivetqdm_disable=True```Set the minimum elevation and other parameters```{python}#| label: define-parametersminimum_solar_angle_deg =30.0latitude_minimum_deg =0.0# equatorlatitude_maximum_deg =90.0# polelatitude_step_deg =15.0# size of steplongitude_deg =0.0# meridianheight_m =0.0# start_date = Time("2025-01-01 00:00:00")end_date = Time("2026-01-01 00:00:00")```Define parameter space. ```{python}#| label: compute-elevation-angles# delta_time = np.linspace(0, 24, 1) * u.hour# create positionslats = np.arange(latitude_minimum_deg, latitude_maximum_deg, latitude_step_deg)pos = EarthLocation(lat=lats,lon=longitude_deg, height=height_m)num_per_day =24*2# 24 hours * 2 - half hour incrementsnum_times =365* num_per_day # 365 days * num_per_daytimes = np.linspace(start_date,end_date,num_times,endpoint=True)daynum = (times - times[0]).jd# this syntax would assign one time to each single location# so times and pos must be the same length# frame = AltAz(obstime=times, location=pos)## instead use list comprehension to create a 2-D array fo position and timesframes = [ AltAz(obstime=_t, location=pos) for _t in tqdm(times,disable=tqdm_disable,desc ='frames') ]# sunlocs is the slow calculationsunlocs = [get_sun(frames[0].obstime).transform_to(_f) for _f in tqdm(frames,disable=tqdm_disable,desc='sunlocs')]alts = [ _sunloc.alt for _sunloc in tqdm(sunlocs,disable=tqdm_disable,desc='alts') ]# reformat into an arrayaltslats = np.zeros([len(times),len(lats)])for ii in tqdm(range(len(alts)),disable=tqdm_disable,desc='altslats'): altslats[ii,:] = alts[ii]```Make a plot of the solar elevation at different latitudes over the entire time.```{python}#| label: fig-elevation#| eval: false#| echo: falsewith time_support(): fig, ax = plt.subplots()for ii,_lat inenumerate(lats): ax.plot(times, altslats[:,ii])#ax.plot(times,_alt,) ax.grid() ax.legend()``````{python}#| label: fig-elevation-2#| fig-cap: Elevation angle over a yaer#| code-fold: truefig, ax = plt.subplots()for ii,_lat inenumerate(lats): ax.plot(daynum, altslats[:,ii],label=f'Latitude {_lat}')ax.axhline(y=minimum_solar_angle_deg, label=f'Min elev {minimum_solar_angle_deg}')ax.set_ylim(bottom=0.0)ax.set_xlabel('Day in year')ax.set_ylabel('Elevation angle')ax.grid()ax.legend()```Compute time per day with sun elevation above the minimum```{python}#| label: daily-time-above-minimum-solar-elevation# find where the elevation is greater or equal than the minimum# creates bool array of size [num_times, num_lats] where True is# above thresholdang_above_min = np.asarray(altslats >= minimum_solar_angle_deg)# now do some scipy-fu to get the number of times per day using# scipy's convolve function# kernel of number of blocks per day normalized to the time of# each block in hoursconv_kernel = np.ones(num_per_day) * np.diff(daynum)[0]*24# compute the sum for each day and select just the first value# for each day. day_sum = np.apply_along_axis(lambda m: sps.convolve(m, conv_kernel, mode='full'), axis=0, arr=ang_above_min)[num_per_day::num_per_day,:]```Plot the result```{python}#| label: fig-hours-above-minimum#| fig-cap: Hours when sun elevation exceeds minimum for each day#| code-fold: truefig, ax = plt.subplots()for ii,_lat inenumerate(lats): ax.plot(daynum[::num_per_day], day_sum[:,ii],label=f'Latitude {_lat}')ax.set_xlabel('Day in year')ax.set_ylabel('Hours above minimum')ax.set_title(f'Hours of sunlight above {minimum_solar_angle_deg} elevation')ax.grid()ax.legend()```## Plot solar elevation at a single point on one daySelect the location and time. This example is Dayton, Ohio.```{python}#| label: location-and-time#llh = np.array([34.73,-86.58,195]) # deg, deg, meter - Huntsvillelocation_name ="Dayton, OH"llh = np.array([39.76,-84.19,226]) # deg, deg, meter - Daytonpos = EarthLocation(lat=llh[0],lon=llh[1],height=llh[2])utcoffset =-5* u.hour # ESTlocal_midnight = Time("2025-11-04 00:00:00") - utcoffset``````{python}#| label: fig-solar-elevationdelta_midnight = np.linspace(0, 24, 1000) * u.hourtimes = local_midnight + delta_midnightframe = AltAz(obstime=times, location=pos)sunaltazs = get_sun(times).transform_to(frame)alts = sunaltazs.altspring_equinox = Time("2025-03-21 00:00:00") - utcoffsetsummer_solstice = Time("2025-06-21 00:00:00") - utcoffsetfall_equinox = Time("2025-09-21 00:00:00") - utcoffsetwinter_solstice = Time("2025-12-21 00:00:00") - utcoffsetspecdates = [spring_equinox,summer_solstice,fall_equinox,winter_solstice]specnames = ["spring equinox","summer solstice","fall equinox","winter solstice"]with quantity_support(): fig, ax = plt.subplots()#ax.xaxis.set_major_formatter(mdates.DateFormatter('%H')) locator = mdates.AutoDateLocator(maxticks=20) ax.plot(delta_midnight, sunaltazs.alt,'r',label=f'{str(local_midnight)}') ax.xaxis.set_major_locator(locator) ax.grid()for sd,sn inzip(specdates,specnames): times = sd + delta_midnight frame = AltAz(obstime=times, location=pos) saz = get_sun(times).transform_to(frame) ax.plot(delta_midnight,saz.alt,'b',label=sn) ax.legend() ax.set_title(f'Solar elevation angle, {location_name}') ylim = np.array(ax.get_ylim()) ylim[0] =0.0 ax.set_ylim(ylim) ax.set_xlabel('Hours after midnight (local)') ax.set_ylabel('Solar elevation [deg]')```